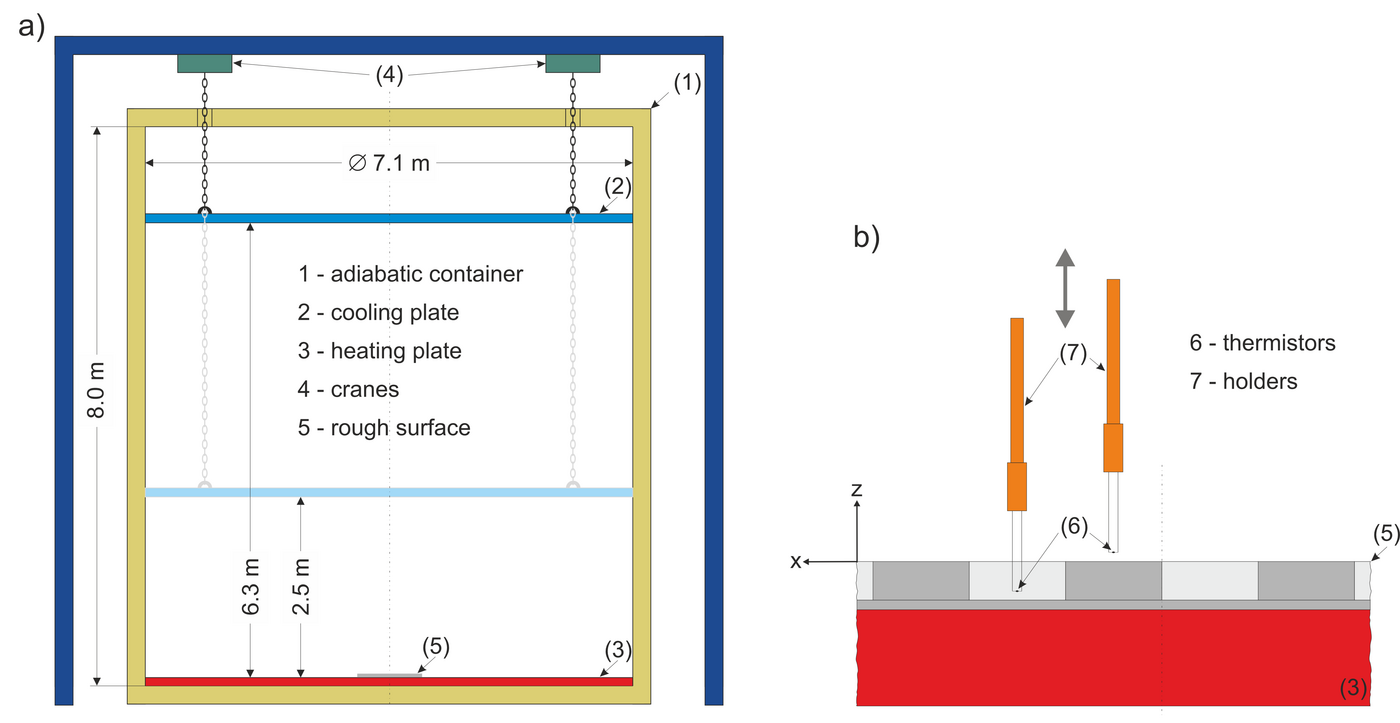
PD Dr.-Ing. habil. Ronald du Puits
Arbeitsgruppenleiter Ilmenauer Fass
+49 (0) 3677 69-1353
The data files can be downloaded as compressed archives.
rbc_temperature_rough_surface.zip

Fig. 1: (a) Principal setup of the large-scale convection facility "Barrel of Ilmenau''. (b) Detailed sketch of a fraction of the rough surface with the temperature sensors. The sketch shows the elements in the correct proportion except the temperature sensors, which are up-scaled by a factor of 2 for better visibility.
We used very tiny thermistors to measure the temperature field near the rough surface. They have an ellipsoidal shape. Their diameter and their length amount to 150 μm and 350 μm, respectively. They are fixed at a holder which can be moved in steps of 10 μμm up and down. The temperature at the top of one cuboid and in one valley in between the cuboids was measured using two of them in an arrangement shown in figure 1(b) The resistance of the thermistors was measured using a PC based data acquisition system. The data rate amounts to 50 samples/s and is sufficiently high to capture even the fastest temperature fluctuations. Before we used the thermistors in the BOI, we calibrated them against a certified PT-100 in a calibration chamber. The remaining uncertainty of ±20 mK was further reduced by an in-situ calibration in the measurement chamber.
| 1.1 | 5.8 x 10¹⁰ | 2.7 | 30.4 | 6.3 | 164.2 | 19.18 |
| 1.1 | 8.6 x 10¹⁰ | 4.0 | 30.5 | 6.3 | 256.8 | 12.26 |
| 1.1 | 1.5 x 10¹¹ | 7.0 | 30.6 | 6.3 | 313.9 | 10.04 |
| 1.1 | 2.2 x 10¹¹ | 10.0 | 30.8 | 6.3 | 361.6 | 8.71 |
| 1.1 | 4.3 x 10¹¹ | 20.0 | 31.2 | 6.3 | 429.2 | 7.34 |
| 1.1 | 6.3 x 10¹¹ | 30.0 | 31.6 | 6.3 | 471.5 | 6.68 |
| 1.1 | 8.0 x 10¹¹ | 38.0 | 31.8 | 6.3 | 542.8 | 5.80 |
| 1.1 | 9.6 x 10¹¹ | 55.0 | 45.0 | 6.3 | 559.0 | 5.64 |
| 2.9 | 5.4 x 10⁹ | 4.0 | 30.3 | 2.5 | 71.7 | 17.44 |
| 2.9 | 9.4 x 10⁹ | 7.0 | 30.5 | 2.5 | 90.4 | 13.82 |
| 2.9 | 1.3 x 10¹⁰ | 10.0 | 30.6 | 2.5 | 106.4 | 11.75 |
| 2.9 | 2.7 x 10¹⁰ | 20.0 | 31.1 | 2.5 | 127.1 | 9.83 |
| 2.9 | 4.0 x 10¹⁰ | 30.0 | 31.5 | 2.5 | 143.4 | 8.72 |
| 2.9 | 5.1 x 10¹⁰ | 38.0 | 30.5 | 2.5 | 160.6 | 7.78 |
| 2.9 | 5.9 x 10¹⁰ | 54.7 | 43.7 | 2.5 | 165.0 | 7.58 |
The data files can be downloaded as compressed archives.
The Excel files contain profiles of mean and rms normalized temperature obtained above the top of a cuboid, above the valley in between the cuboids, and from a smooth surface as a reference, for each aspect ratio and Rayleigh number in a seperate sheet. The underlying time series can be requested from Ronald du Puits.
| [1] | du Puits, R. (2024), Thermal boundary layers in turbulent Rayleigh-Bénard convection with rough and smooth surfaces, Phys. Rev. Fluids, Vol. 9, p. 023501. |
| [2] | du Puits, R., Resagk, C., Thess, A. (2013), Thermal boundary layers in turbulent Rayleigh–Bénard convection at aspect ratios between 1 and 9, New J. Physics, Vol. 15, p. 013040. |